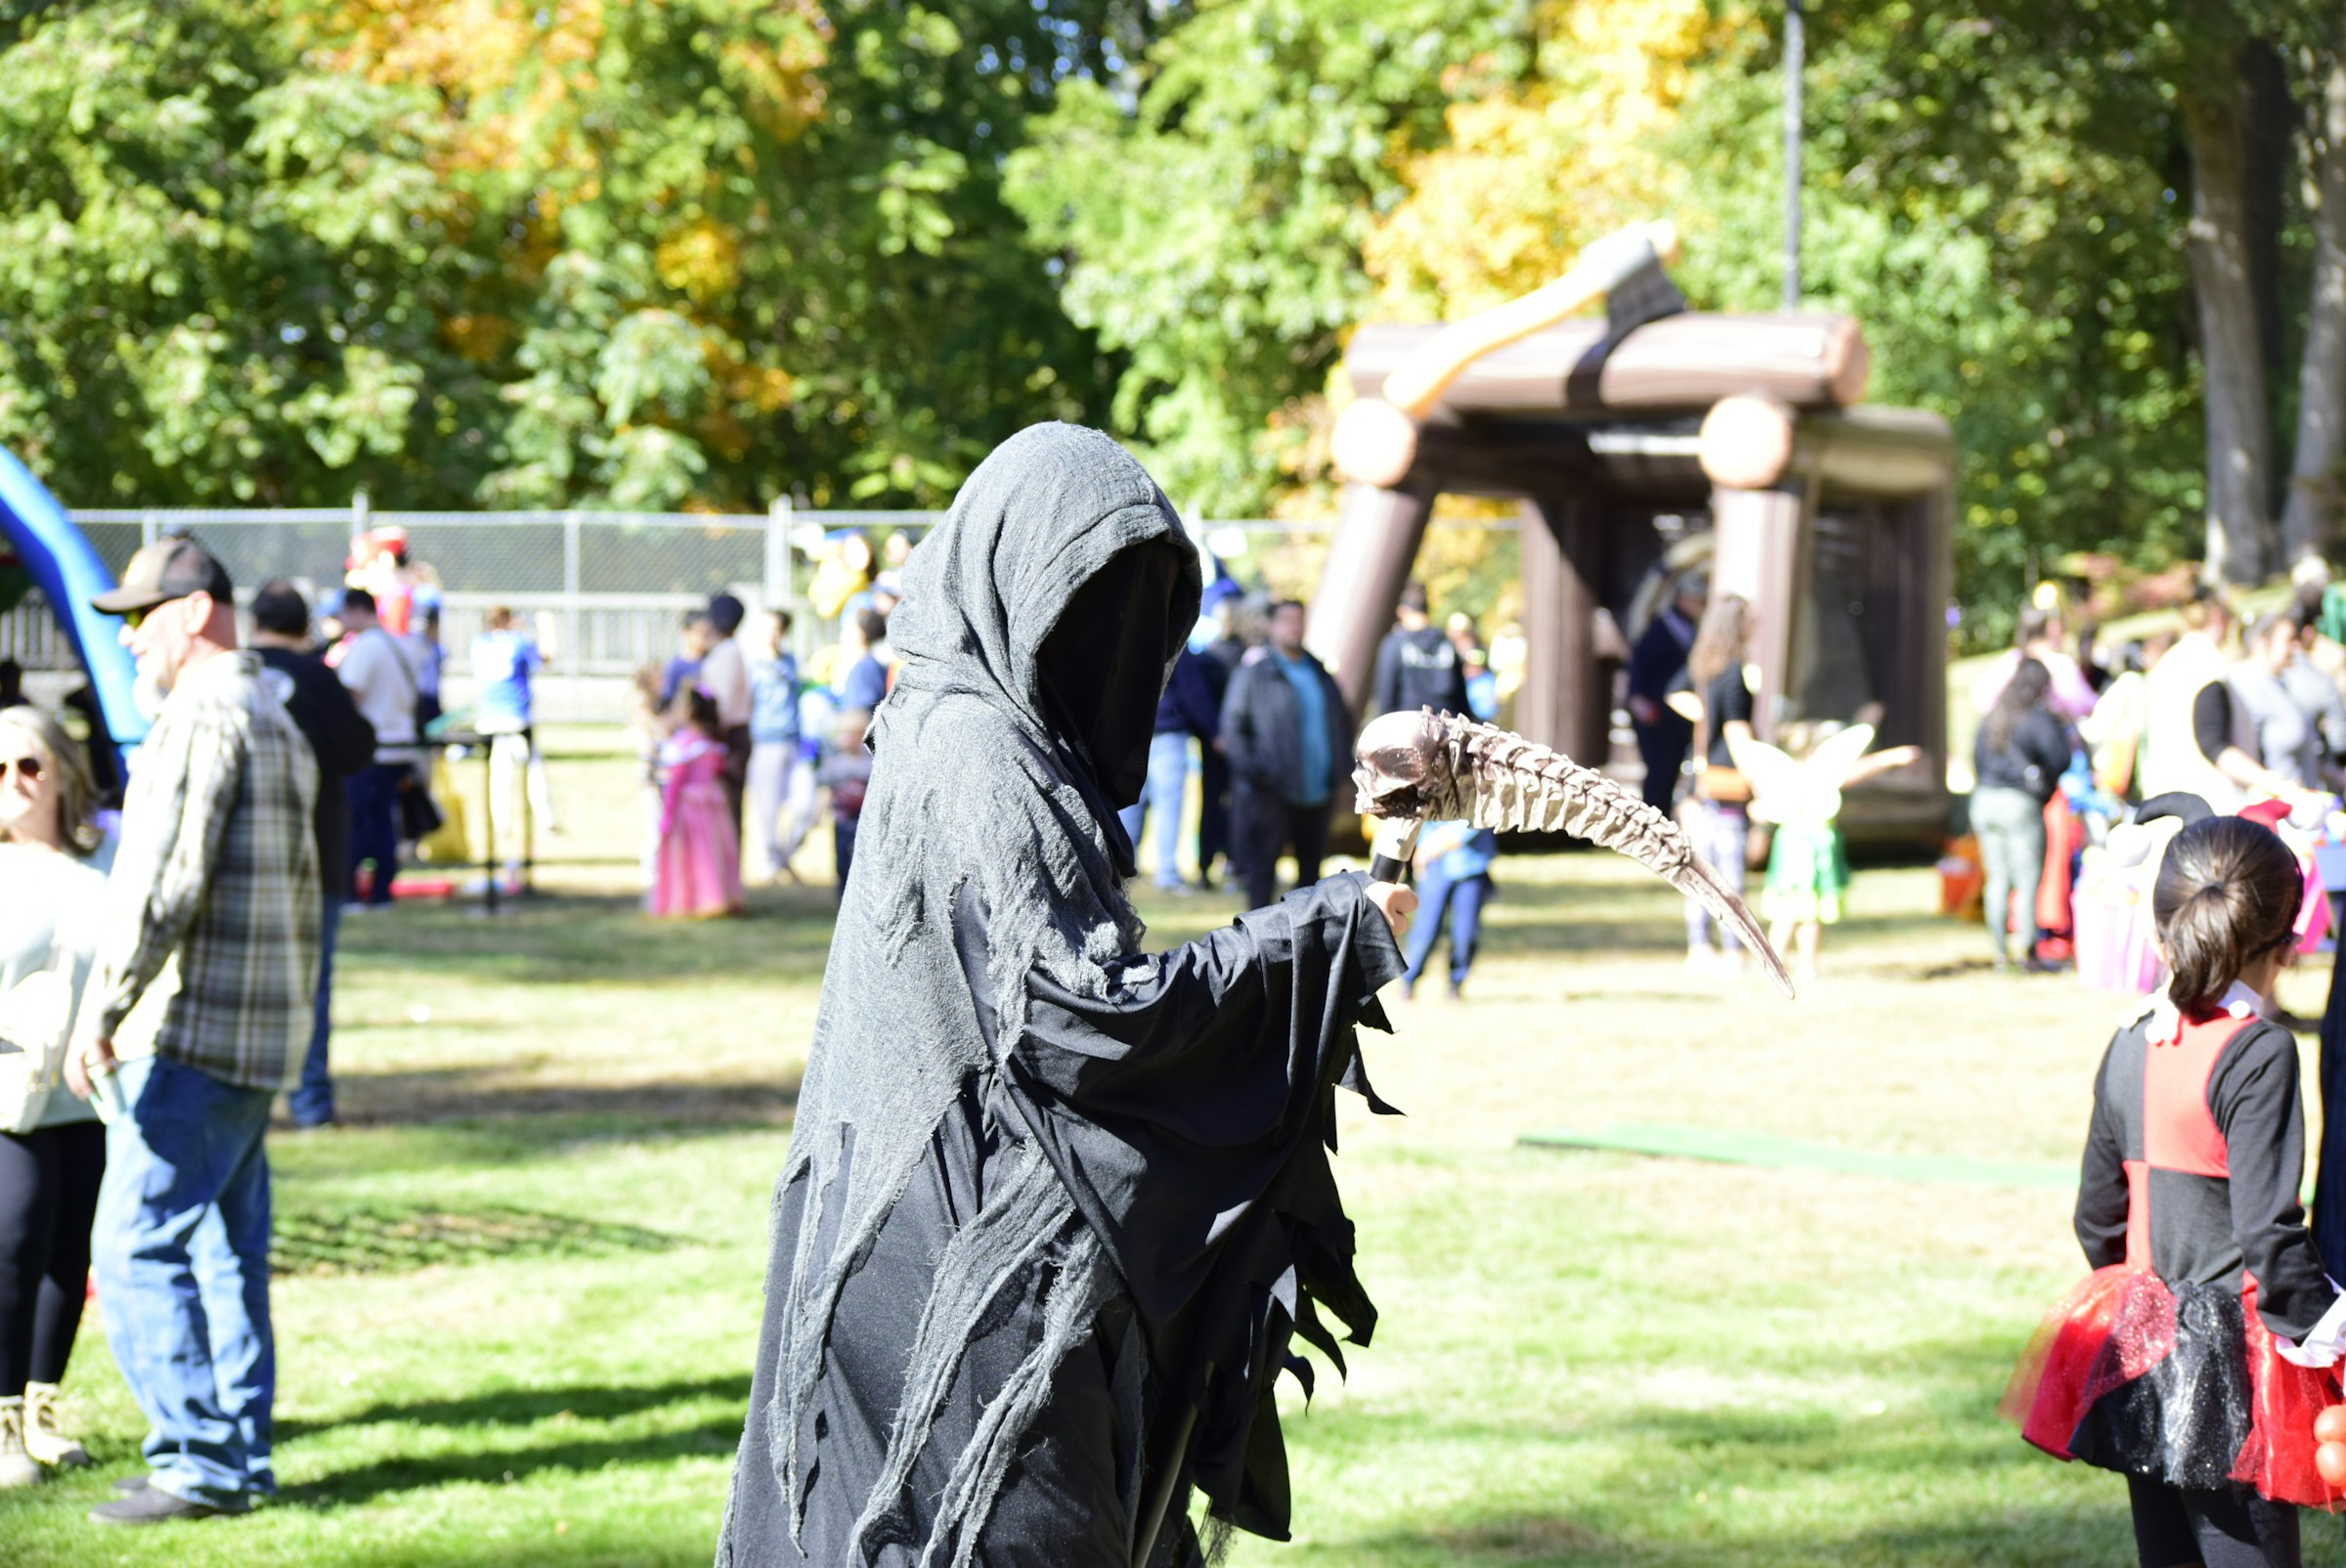

Halloween looks radically different from one street to the next. One block might see hundreds of costumed kids streaming past decorated porches, while the next street over goes almost completely quiet. That gap isn’t random, and it isn’t simply about how many kids live nearby.
A range of measurable factors, from street design to social psychology, shape where families choose to take their children on October 31. According to the 2024 Farmers’ Almanac report, approximately 35 million children participate in trick-or-treating annually, yet the crowds are anything but evenly distributed. Understanding what draws them tells you a lot about how neighborhoods actually function.
The Child Population Factor
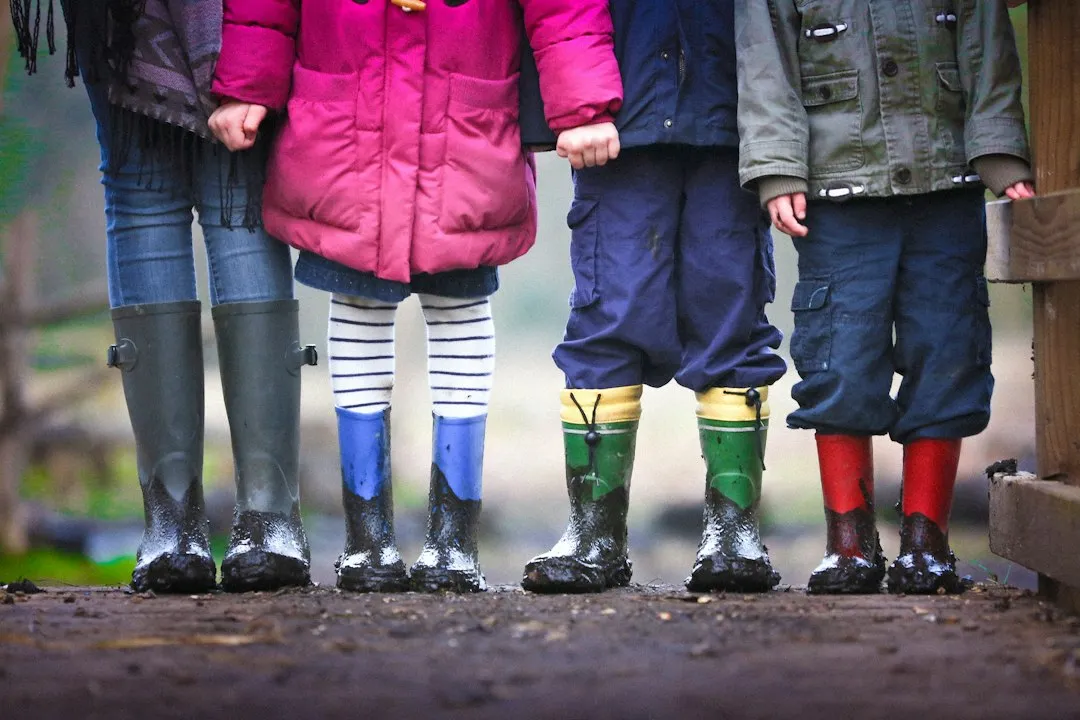
The density of children aged 14 and younger offers direct insight into areas where trick-or-treating activity may be most concentrated. Where more kids live, more kids go out. That sounds obvious, but it compounds quickly when you factor in that families from nearby streets will also migrate toward those same clusters.
In the St. Louis region, for example, St. Louis City stands out with 763 children per square mile, making it a likely hotspot for Halloween activity. Nationwide, the estimated number of U.S. children under the age of 18 as of July 2025 sits at roughly 72 million, but their geographic distribution is far from uniform, which is why some streets feel like parades and others feel empty.
Housing Type Makes a Big Difference
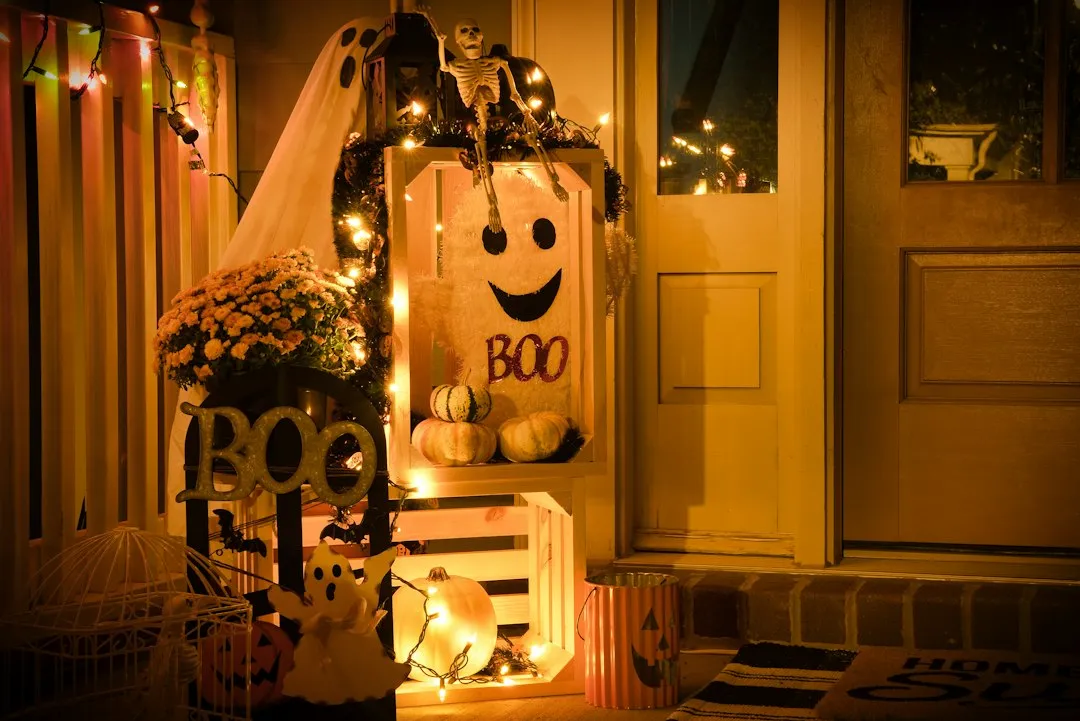
Not all homes are equally inviting for trick-or-treaters. Single-family houses and two-unit buildings, where a door opens directly to a sidewalk, are the natural targets for kids going door to door. Apartment towers with locked lobbies and buzzer systems are a much harder proposition.
The San Francisco Chronicle’s data team identified the factors that make an area good to trick-or-treat: lots of kids aged 5 to 14, a high share of single-family or two-unit homes where you can easily knock on doors from the street, and how close those homes are together. In one of the city’s top-ranked census tracts, roughly 96 percent of homes had two units or fewer, which creates an unbroken sequence of accessible doorsteps for kids to work through efficiently.
Walkability Is a Core Requirement
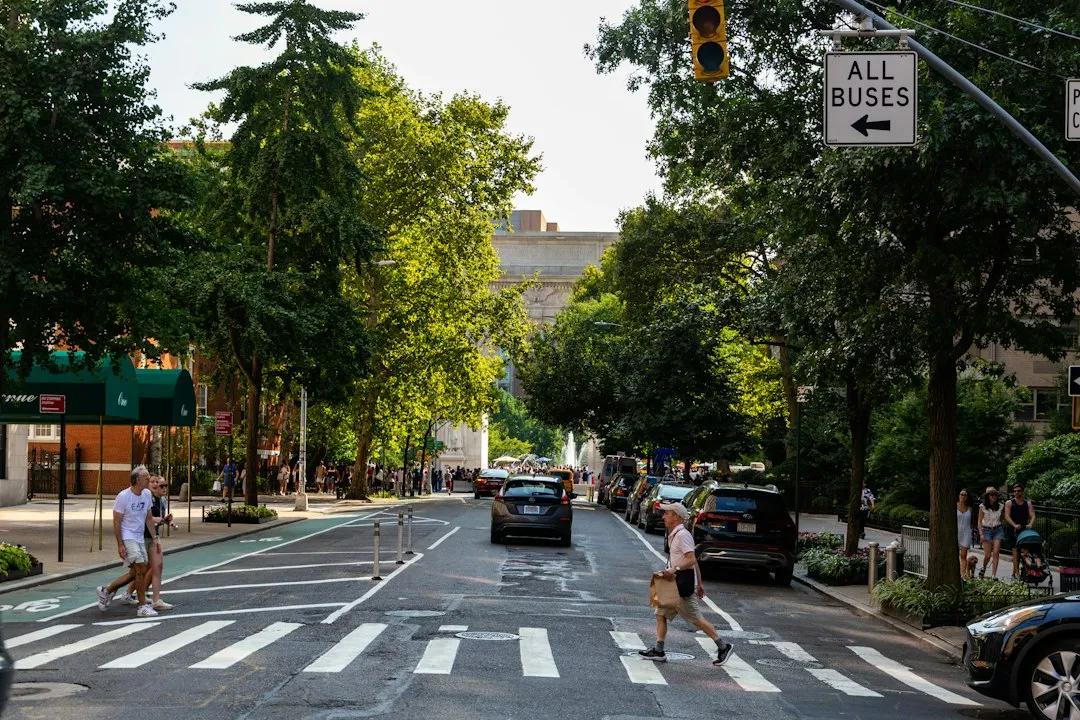
A neighborhood can have plenty of kids and plenty of houses, but if those houses are separated by wide roads with no sidewalks, trick-or-treating becomes impractical and unsafe. Walkability is the connective tissue that makes the whole experience work.
Researchers evaluating top trick-or-treating cities weigh housing density to ensure homes are close enough for efficient candy stops, crime rates, and walkability so kids don’t have to hike between houses. A neighborhood with a walkability score above 70, indicating that most errands can be completed on foot, is far more likely to facilitate a smooth trick-or-treating experience compared to suburban developments with scores below 50, where cars are needed to navigate between homes.
Safety Perceptions Shape Where Families Go
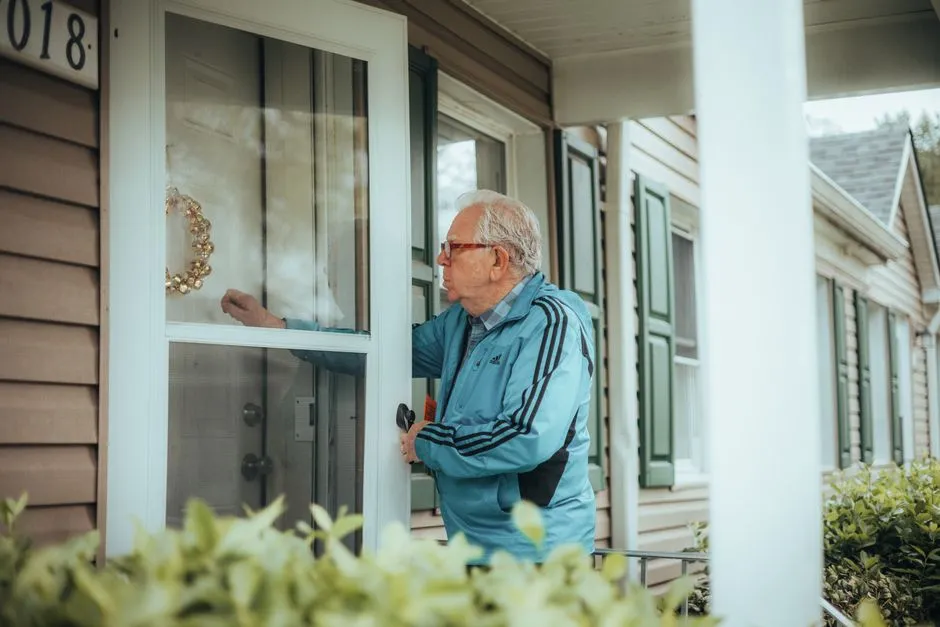
Parents choose streets the same way they make most decisions for their children: with safety as the first filter. Low crime rates, good lighting, and visible police presence all contribute to whether a neighborhood ends up on the mental shortlist for Halloween night.
Pembroke Pines, Florida, and Yonkers, New York, lead 2026 safety rankings based on their pedestrian safety, low violent crime rates, and low numbers of registered sex offenders. According to the latest FBI data, violent crime fell 9.3 percent and property crime dropped 12.4 percent from 2024 to 2025, which is broadly positive, but safety conditions still vary widely by city and neighborhood, keeping parental caution a real factor in routing decisions.
Street Design and Traffic Volume
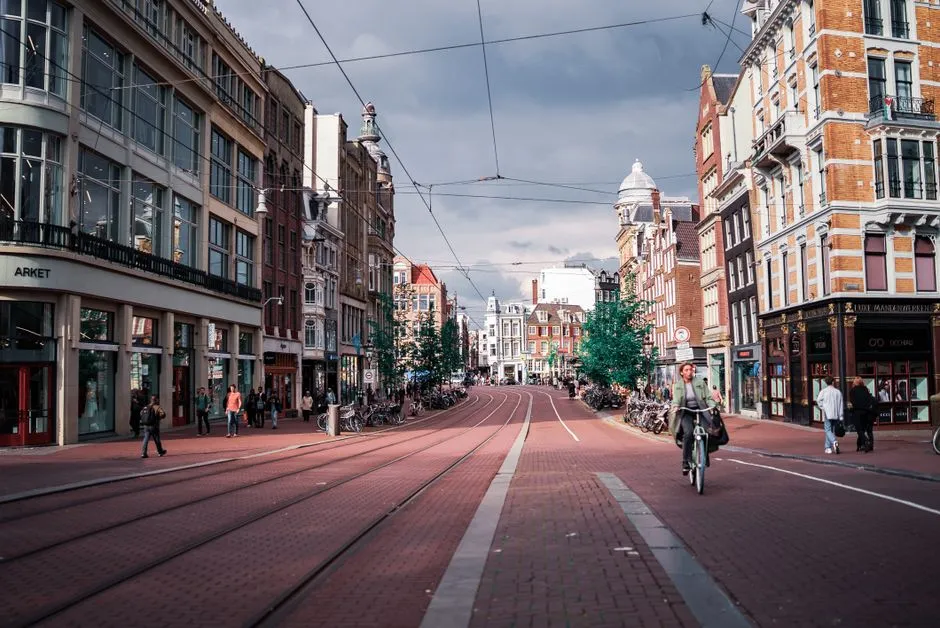
The physical layout of a street does quiet but powerful work in determining how comfortable Halloween foot traffic feels. Streets that are narrower, have fewer crossings interrupted by heavy through-traffic, and keep cars moving slowly are naturally more appealing for walking families.
Research from the Massachusetts Housing Partnership found that the best blocks for trick-or-treating tend to have homes a little closer to the street and less interruption from cross streets and through traffic. When scouting good places to go, look for homes closer together and streets with more foot traffic than car traffic. Some streets become so popular that local authorities intervene: Miami Beach’s Lakeview neighborhood takes Halloween so seriously that police shut down the roads every year to keep cars out.
The Decoration Effect and Social Contagion
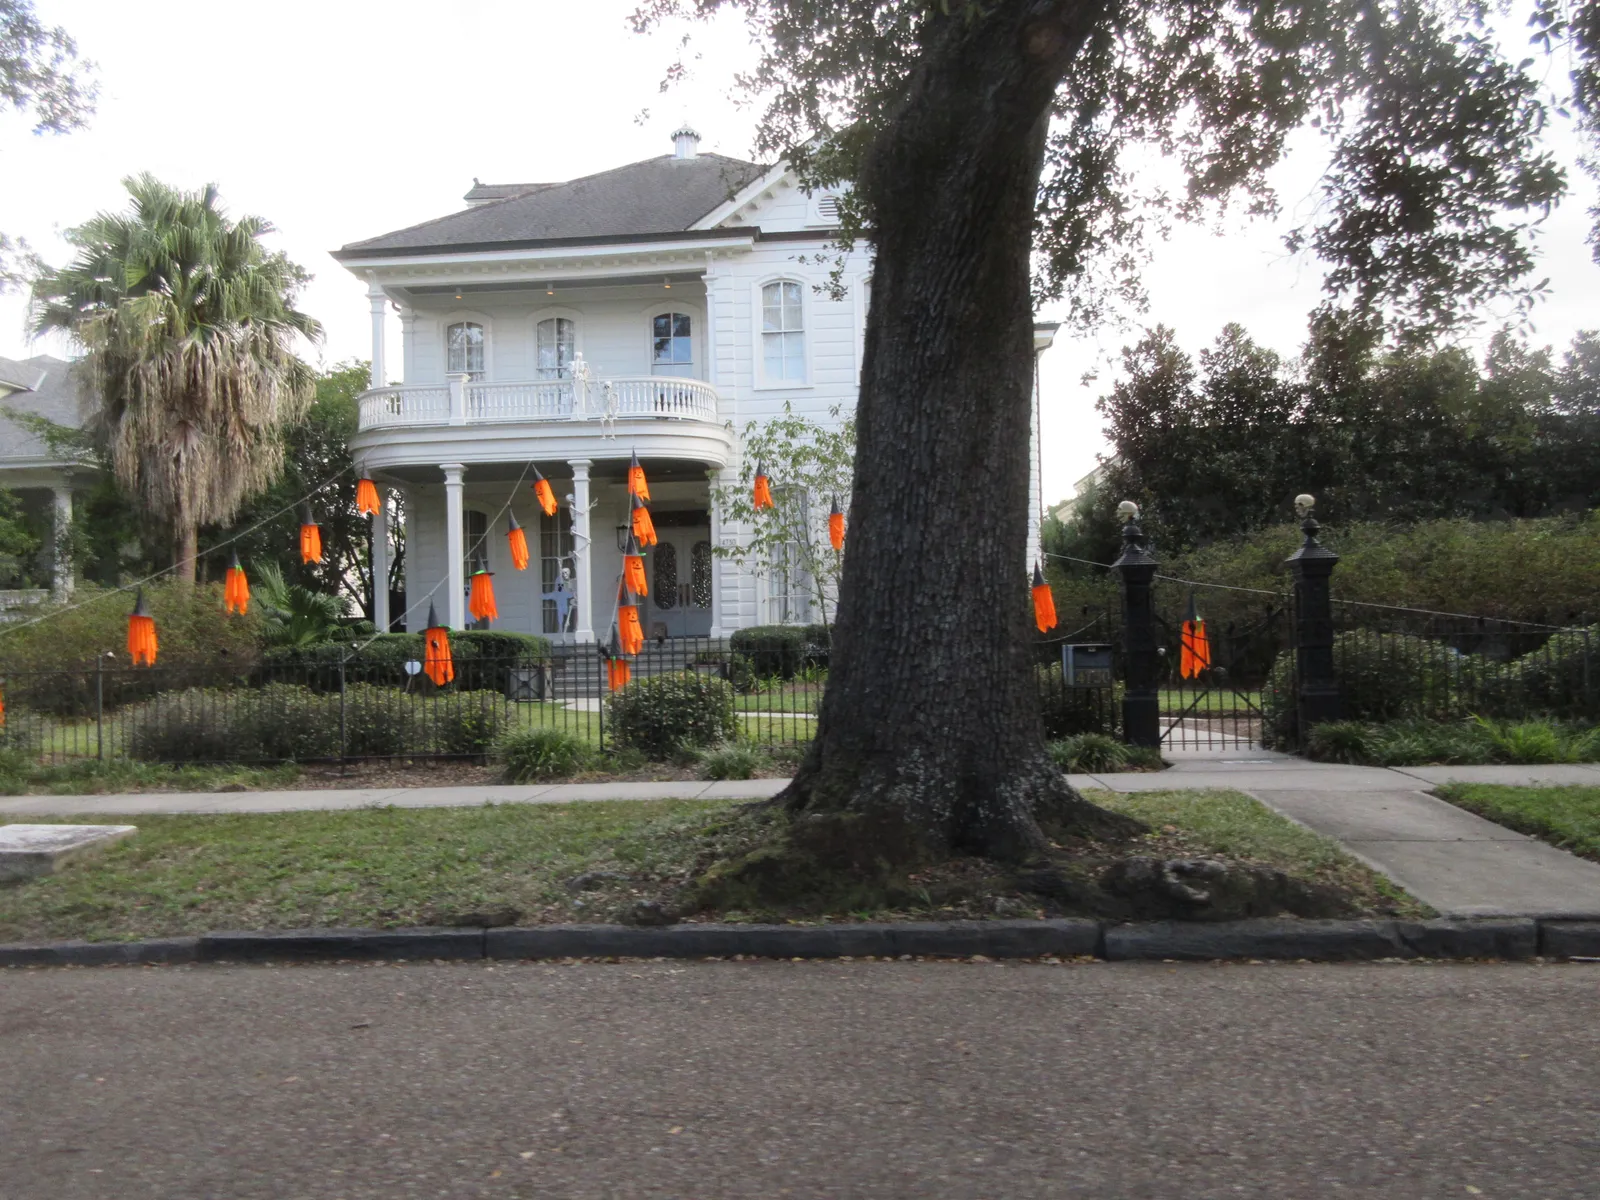
Decorations do more than signal festivity. They act as a visible invitation, broadcasting to passing families that this particular house is participating. Streets with heavy decoration tend to pull in far more traffic than undecorated ones, even if the underlying demographics are similar.
A study published in the journal Environment and Behavior found that decorating for Halloween was associated with neighborhood attachment, and that decorating tended to cluster by block: when one household decorated, neighbors often did too, a pattern consistent with social contagion. Crowd-reported data from Vancouver similarly found that houses rated as having “Spooktacular” decorations were much more likely to report over 300 trick-or-treaters in a single evening.
The Self-Fulfilling Prophecy of Participation
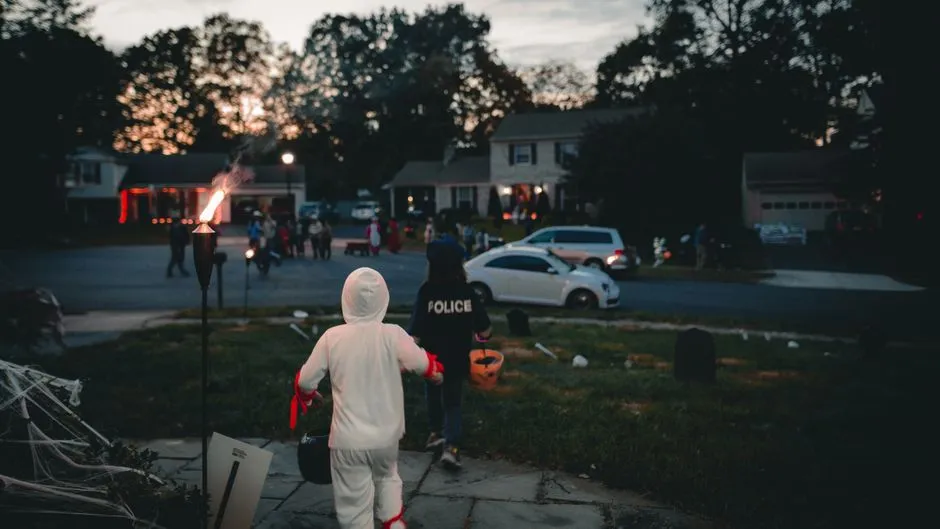
One of the stranger dynamics driving neighborhood popularity is a feedback loop built entirely on assumptions. Families skip a street because they assume no one will hand out candy. Homeowners don’t buy candy because they assume no one will show up. The result: both sides confirm each other’s fears.
Research from Rocket Companies found that just 51 percent of parents take their young children trick-or-treating on their own street, despite 86 percent of families saying their neighborhood is a great place to go door to door. More than half of families surveyed assume that not enough homes in their neighborhood will participate to make the night worthwhile, and nearly four in ten households said they did not hand out candy last Halloween because they expected no one would show up.
The Rise of Destination Neighborhoods

Families increasingly treat Halloween as a travel event rather than a stay-local tradition. Rather than heading out to their own block, they load into a car and drive to a neighborhood with a known reputation for going big. This concentrates foot traffic dramatically in a small number of places.
Destination neighborhoods are often wealthy ones, where million-dollar homes are more likely to dole out full-sized candy bars or put up elaborate decorations year after year. Spending drops in places that no longer receive trick-or-treaters, while it rises in the affluent neighborhoods that become the destinations, reinforcing the gap between hot spots and overlooked streets with each passing year.
Weather and the October Calendar

A warm, dry evening with mild temperatures draws far more foot traffic than a cold, rainy one. Weather isn’t a neighborhood characteristic in the strict sense, but it interacts closely with neighborhood type: families are more willing to walk longer distances in pleasant conditions, which naturally benefits streets with greater walkable reach.
Illinois ranks highly for trick-or-treating in part because of its strong walkability scores, while families there also benefit from crisp Halloween nights averaging around 51°F, a temperature that’s genuinely comfortable for walking in costume. The timing of Halloween falling on a school night versus a weekend also shifts how many families go out and for how long, which can noticeably change counts from one year to the next.
Pedestrian Safety and the Hidden Risk Factor
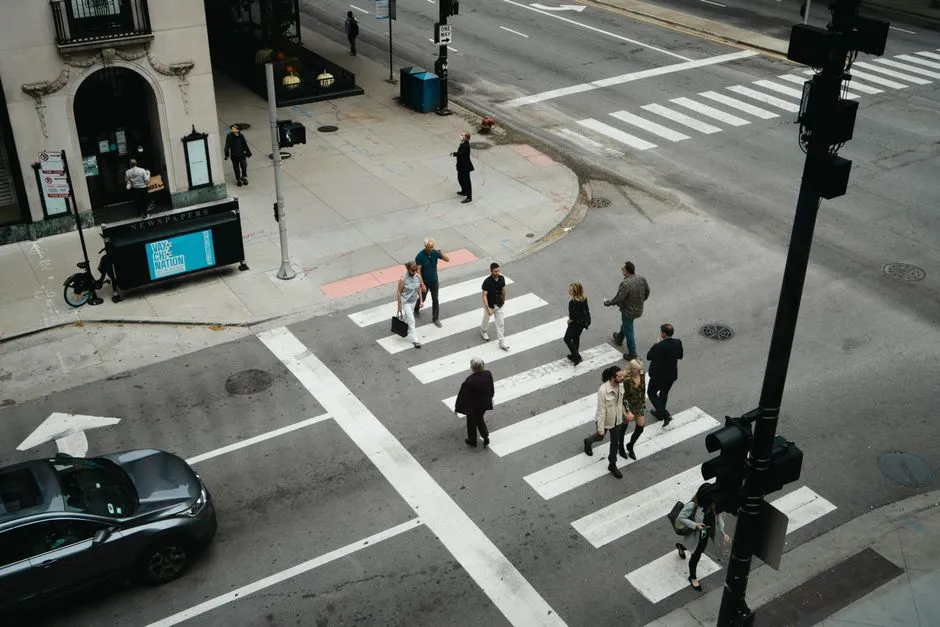
High trick-or-treat traffic carries a shadow side that families rarely think about consciously but respond to instinctively. Streets that feel physically unsafe for young pedestrians, even if they have lots of participating houses, tend to get avoided by cautious parents.
Research published in the Journal of the American Medical Association, drawing on 42 years of data from the National Highway Traffic Safety Administration, found that the risk of pedestrian fatalities is 43 percent higher on Halloween compared to any other night. The riskiest window is between 6 p.m. and 7 p.m., when sunset, rush hour, and prime trick-or-treating time all converge. Neighborhoods that calm traffic during those hours, whether through road closures, speed tables, or simply quiet residential design, hold a real advantage in attracting and keeping families.
The Takeaway

The gap between a block that sees 200 kids and one that sees five isn’t a mystery. It’s the product of child density, housing type, walkability, perceived safety, street design, decoration culture, and the expectations families carry with them before they even leave the house.
What’s worth noting is that some of those factors are genuinely fixed, tied to demographics or urban planning decisions made decades ago. Others, like whether you decorate, whether you turn on your porch light, whether your neighborhood coordinates over a group chat, are entirely within reach. The survey evidence suggests the answer may have less to do with neighborhoods themselves and more to do with whether families expect their neighbors to participate. That’s a softer form of community infrastructure, but it shapes Halloween night just as much as any sidewalk.
AI Disclaimer: This article was created with the assistance of AI tools and reviewed by a human editor.